Track and Monitor Your ASP.NET Core Minimal API with OpenTelemetry
Introduction: Observability Made Easy with OpenTelemetry
In modern software development, especially in distributed systems, understanding how your application behaves in real time is crucial. This is where observability comes in. Observability allows you to monitor, analyze, and diagnose the performance of your application transparently, without disrupting its primary operations. Unlike traditional debugging, which can be invasive, observability provides continuous insights into your application’s health and performance.
Observability typically relies on three key components, often called the three pillars of observability:
- Logs: Provide recorded information about specific operations, such as incoming requests or application failures.
- Metrics: Capture measurements like total requests, latency, or server resource utilization.
- Distributed Tracing: Tracks end-to-end request paths, helping pinpoint bottlenecks and failures in complex systems.
In the .NET world, OpenTelemetry (OTel) has become the industry standard for collecting and emitting telemetry data. OpenTelemetry integrates seamlessly with .NET since .NET already provides built-in APIs for logging, metrics, and tracing. With tools like OpenTelemetry, you can observe your application’s behavior and send telemetry data to various monitoring and visualization tools such as Grafana, Jaeger, and Azure Monitor.
In this article, we’ll learn how to integrate OpenTelemetry into an ASP.NET Core Minimal API, using a simple weather API as an example. By the end of this tutorial, you’ll have a clear understanding of how to monitor and track the performance of your application by collecting logs, metrics, and traces all using free tools like Jaeger and Grafana.
What’s great about OpenTelemetry is that it’s cross-platform, widely supported, and doesn’t lock you into a specific vendor. As a result, you’re free to use monitoring backends that best fit your needs, whether they’re open-source tools like Prometheus and Grafana, or cloud services like Azure Monitor. Let’s dive in and see how OpenTelemetry can bring observability to your ASP.NET Core Minimal API.

Example: Building a Minimal API in .NET with OpenTelemetry Tracing and Jaeger
Disclaimer: This example is intended for educational purposes only. While it demonstrates key concepts, there are more efficient ways to write and optimize this code in real-world applications. Consider this a starting point for learning, and always aim to follow best practices and refine your implementation.
Prerequisites
Before starting, make sure you have the following installed:
- .NET SDK: Download and install the .NET SDK if you haven’t already.
- Visual Studio Code (VSCode): Install Visual Studio Code for a lightweight code editor.
- C# Extension for VSCode: Install the C# extension for VSCode to enable C# support.
- Docker: Required to run Jaeger. Install Docker.
This example is intended for development and learning purposes only. While it demonstrates a simple JWT implementation in ASP.NET Core using dotnet user-jwts, you should use a production-ready token generation system (e.g., IdentityServer, Azure AD, or another identity provider) in real-world applications.
Step 1: Create a New Minimal API Project
dotnet new webapi -minimal -n OpenTelemetryApi
cd OpenTelemetryApi
Step 2: Install Required Dependencies
For OpenTelemetry integration, edit your .csproj file and add the following dependencies:
<ItemGroup>
  <PackageReference Include="Microsoft.AspNetCore.OpenApi" Version="9.0.0" />
  <PackageReference Include="OpenTelemetry.Exporter.Console" Version="1.11.1" />
  <PackageReference Include="OpenTelemetry.Exporter.OpenTelemetryProtocol" Version="1.11.1" />
  <PackageReference Include="OpenTelemetry.Extensions.Hosting" Version="1.11.1" />
  <PackageReference Include="OpenTelemetry.Instrumentation.AspNetCore" Version="1.11.0" />
  <PackageReference Include="OpenTelemetry.Instrumentation.Http" Version="1.11.0" />
</ItemGroup>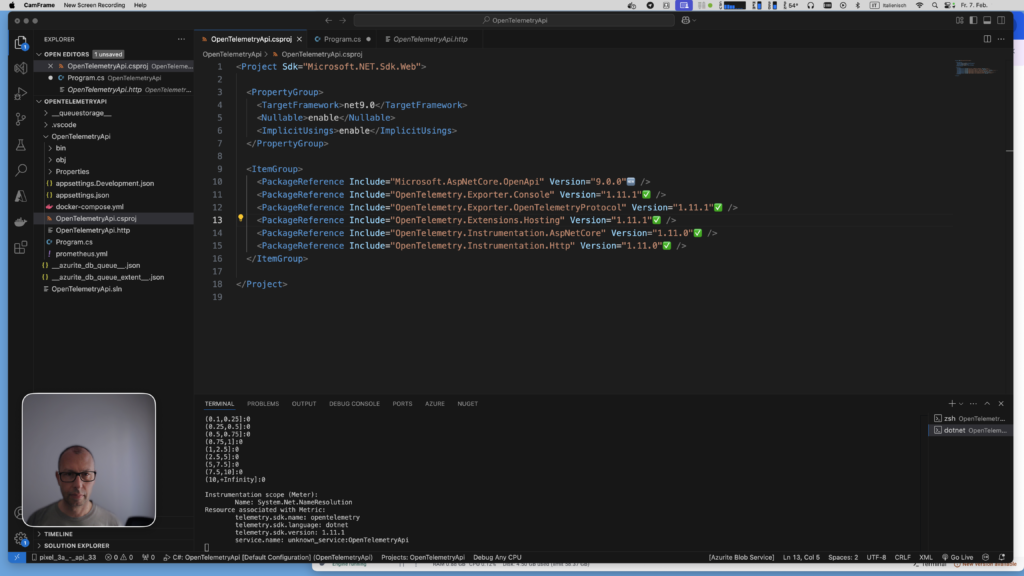
Install the dependencies by running:
dotnet restoreThese dependencies are required for:
- OpenTelemetry SDK: Provides instrumentation for HTTP requests and ASP.NET Core.
- Console Exporter: Writes traces to the console.
- OTLP Exporter: Sends data in OpenTelemetry Protocol format.
- Hosting Extensions: Simplifies configuration in .NET’s dependency injection system.
- Instrumentation: Automatically captures tracing and metrics for HTTP and ASP.NET Core.
Step 3: Update Your Code
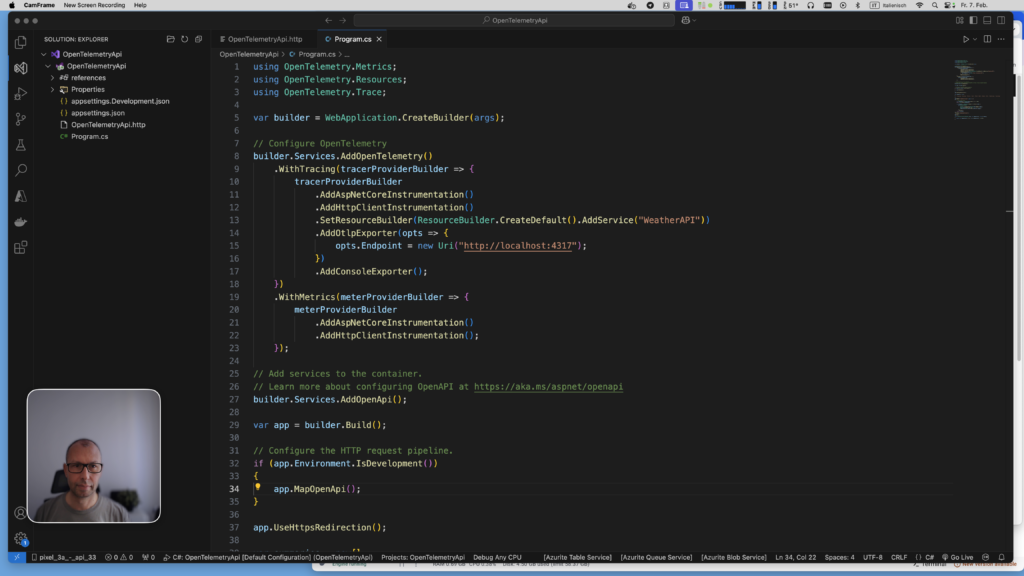
Replace the content of your Program.cs file with the following code, which configures OpenTelemetry and a sample endpoint.
using OpenTelemetry.Metrics;
using OpenTelemetry.Resources;
using OpenTelemetry.Trace;

var builder = WebApplication.CreateBuilder(args);

// Configure OpenTelemetry
builder.Services.AddOpenTelemetry()
    .WithTracing(tracerProviderBuilder => {
        tracerProviderBuilder
            .AddAspNetCoreInstrumentation()
            .AddHttpClientInstrumentation()
            .SetResourceBuilder(ResourceBuilder.CreateDefault().AddService("WeatherAPI"))
            .AddOtlpExporter(opts => {
                opts.Endpoint = new Uri("http://localhost:4317");
            })
            .AddConsoleExporter();
    })
    .WithMetrics(meterProviderBuilder => {
        meterProviderBuilder
            .AddAspNetCoreInstrumentation()
            .AddHttpClientInstrumentation();
    });

// Add services to the container.
// Learn more about configuring OpenAPI at https://aka.ms/aspnet/openapi
builder.Services.AddOpenApi();

var app = builder.Build();

// Configure the HTTP request pipeline.
if (app.Environment.IsDevelopment())
{
    app.MapOpenApi();
}

app.UseHttpsRedirection();

var summaries = new[]
{
    "Freezing", "Bracing", "Chilly", "Cool", "Mild", "Warm", "Balmy", "Hot", "Sweltering", "Scorching"
};

app.MapGet("/weatherforecast", async () =>
{
    // Add Random Delay
    var randomDelay = Random.Shared.Next(1, 6) * 1000;
    await Task.Delay(randomDelay);

    var forecast =  Enumerable.Range(1, 5).Select(index =>
        new WeatherForecast
        (
            DateOnly.FromDateTime(DateTime.Now.AddDays(index)),
            Random.Shared.Next(-20, 55),
            summaries[Random.Shared.Next(summaries.Length)]
        ))
        .ToArray();
    return forecast;
})
.WithName("GetWeatherForecast");

app.Run();

record WeatherForecast(DateOnly Date, int TemperatureC, string? Summary)
{
    public int TemperatureF => 32 + (int)(TemperatureC / 0.5556);
}
Code Breakdown
Below, we explain each part of the code:
1. OpenTelemetry Tracing Configuration
builder.Services.AddOpenTelemetry()
    .WithTracing(tracerProviderBuilder =>
    {
        tracerProviderBuilder
            .AddAspNetCoreInstrumentation()
            .AddHttpClientInstrumentation()
            .SetResourceBuilder(ResourceBuilder.CreateDefault().AddService("WeatherAPI"))
            .AddOtlpExporter(opts =>
            {
                opts.Endpoint = new Uri("http://localhost:4317");
            })
            .AddConsoleExporter();
});AddAspNetCoreInstrumentation: Captures incoming requests to the API.AddHttpClientInstrumentation: Tracks outgoing HTTP requests made viaHttpClient.SetResourceBuilder: Adds metadata about the service to the telemetry (e.g., service name:WeatherAPI).AddOtlpExporter: Sends the trace data to an OTLP collector (e.g., Jaeger).AddConsoleExporter: Outputs telemetry to the console, useful for debugging.
2. OpenTelemetry Metrics Configuration
.WithMetrics(meterProviderBuilder =>
{
    meterProviderBuilder
        .AddAspNetCoreInstrumentation()
        .AddHttpClientInstrumentation();
});
Captures metrics related to incoming and outgoing HTTP requests.
4. Random Delay in API Endpoint
var randomDelay = Random.Shared.Next(1, 6) * 1000;
await Task.Delay(randomDelay);
Introduces a random delay of 1 to 5 seconds in the /weatherforecast endpoint. This simulates varying response times, which helps during tracing and debugging.
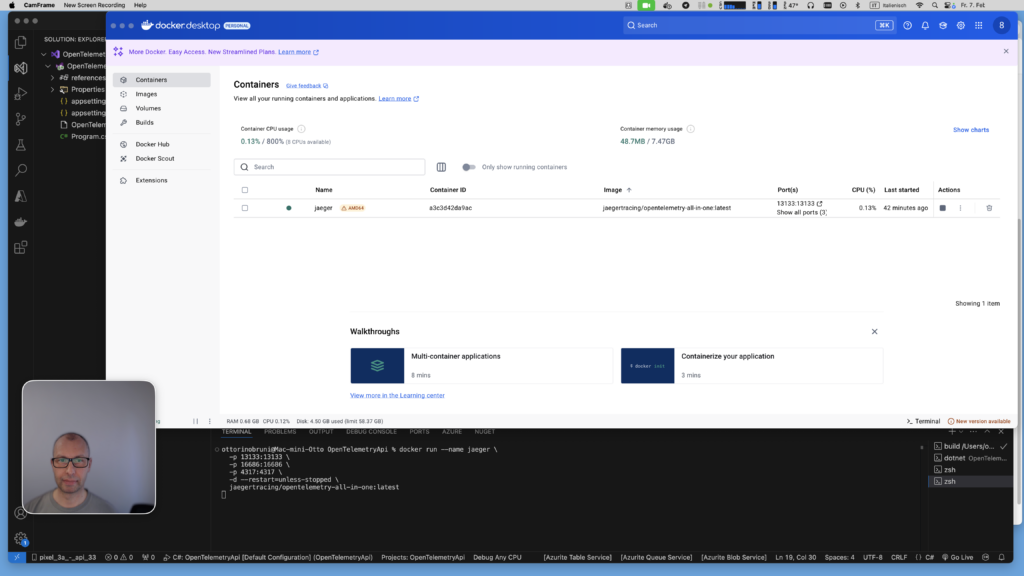
Step 4: Run Jaeger for Observability
To view traces from your API, run Jaeger as a container using Docker:
docker run --name jaeger \
  -p 13133:13133 \
  -p 16686:16686 \
  -p 4317:4317 \
  -d --restart=unless-stopped \
  jaegertracing/opentelemetry-all-in-one:latest
Explanation of Jaeger Ports
16686: The Jaeger UI. Accessible in the browser at http://localhost:16686.4317: Accepts trace data via OTLP (used by OpenTelemetry).13133: Health check endpoint for Jaeger.
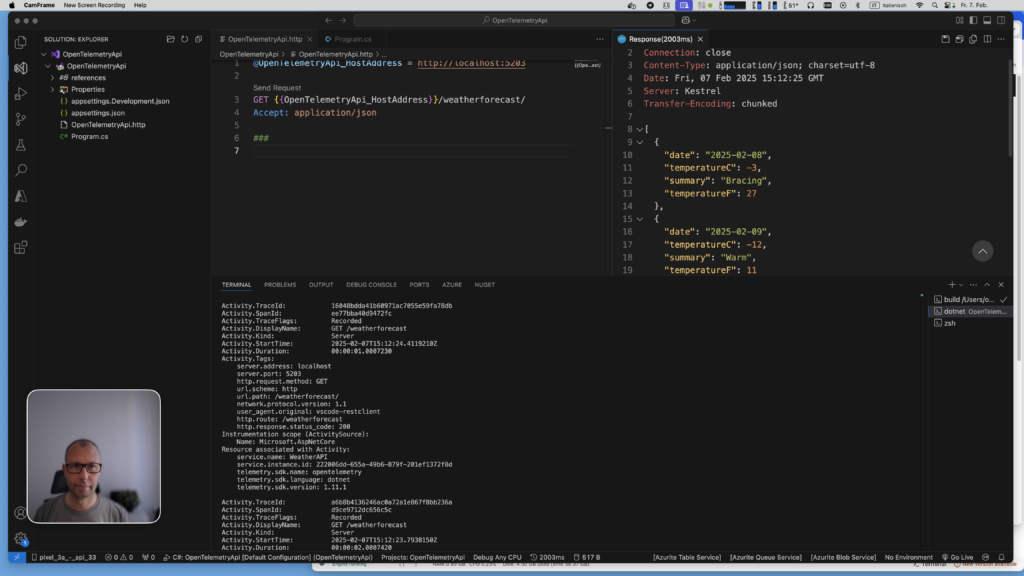
Step 5: Run and Test the Application
Start your application:
dotnet runCall the /weatherforecast endpoint multiple times to generate spans with random delays.
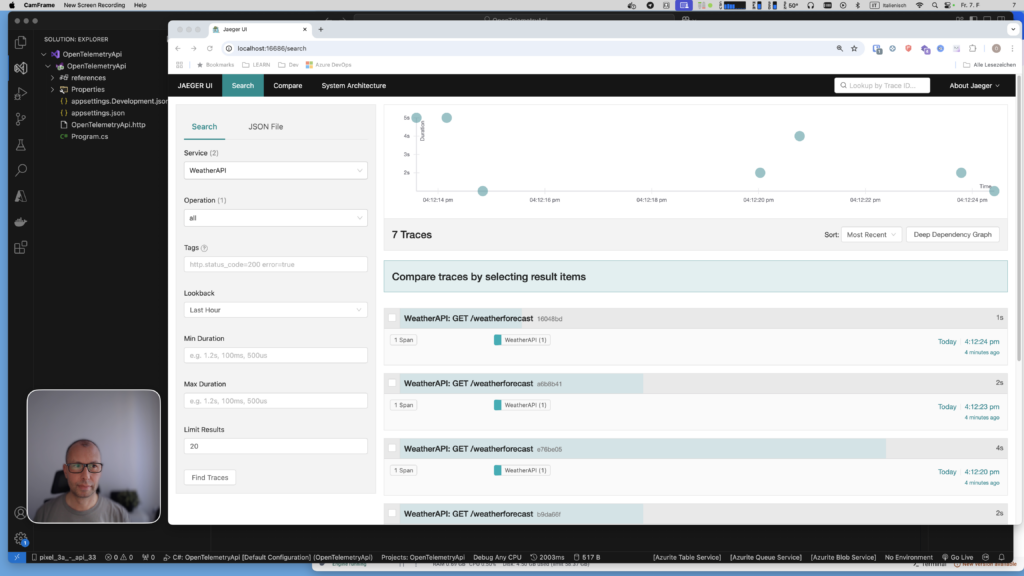
Step 6: Observe Traces in Jaeger
- Open Jaeger UI at http://localhost:16686.
- Search for traces associated with the
WeatherAPIservice. - View individual traces to observe spans with varying durations due to the random delay.
What Is Jaeger?
Jaeger is an open-source, end-to-end distributed tracing system designed to monitor and troubleshoot microservices-based applications. It helps developers:
- Monitor request latencies.
- Understand service dependencies.
- Trace performance bottlenecks.
With OpenTelemetry, Jaeger is seamlessly integrated as an observability backend via the OTLP protocol.
Conclusion
In a world increasingly driven by microservices and distributed architectures, having the right tools to understand how our applications behave and where potential issues arise is critical. This is where OpenTelemetry comes into play, offering a standardized and easy-to-use solution for collecting telemetry data such as logs, metrics, and traces. OpenTelemetry integrates seamlessly with .NET, making it incredibly straightforward to add powerful observability capabilities to our projects.
As we’ve seen in this article, with just a few lines of code, we were able to integrate OpenTelemetry into our .NET API project and export data to Jaeger for analysis. This demonstrates how simple it is to enable observability in your applications without introducing unnecessary complexity.
Monitoring metrics, logs, and traces is not just an option — it’s a necessity. This data provides the tools to identify bottlenecks, optimize performance, and quickly diagnose issues. We can gain detailed insights into the lifecycle of a request, analyze response times, and observe interactions between services. All of this helps us not only fix problems faster but also build more reliable and resilient applications.
Thanks to free tools such as Jaeger, Prometheus, Grafana, and many others, analyzing telemetry data has never been easier. OpenTelemetry makes it possible to integrate these tools effortlessly, and the learning curve is minimal.
In future posts, I will show how to fully integrate OpenTelemetry with frameworks like .NET Aspire and explore how to extend its capabilities even further. With the right tools and practices, achieving high observability is no longer a complicated or expensive task.
If you think your friends or network would find this article useful, please consider sharing it with them. Your support is greatly appreciated.
Thanks for reading!
 Discover CodeSwissKnife, your all-in-one, offline toolkit for developers!
Click to explore CodeSwissKnife 